
IoT (Internet of Things) and Big Data are very relevant today, and they tend to appear together. This happens because the most accepted definition of of IoT is having a lot of wireless sensors generating data continuously. This requires having the infrastructure to be able to save all the data that is generated in databases. However, this presents a problem when doing queries, since queries in big databases (millions of samples) take a long time to finish. Reducing this time is the objective of the following project.
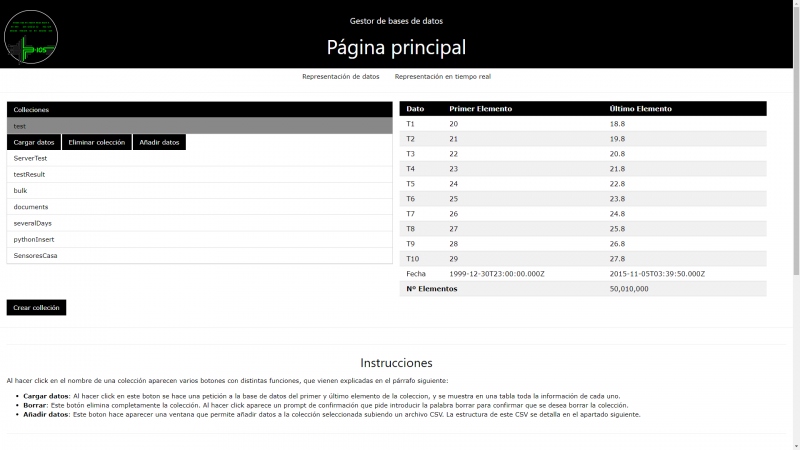
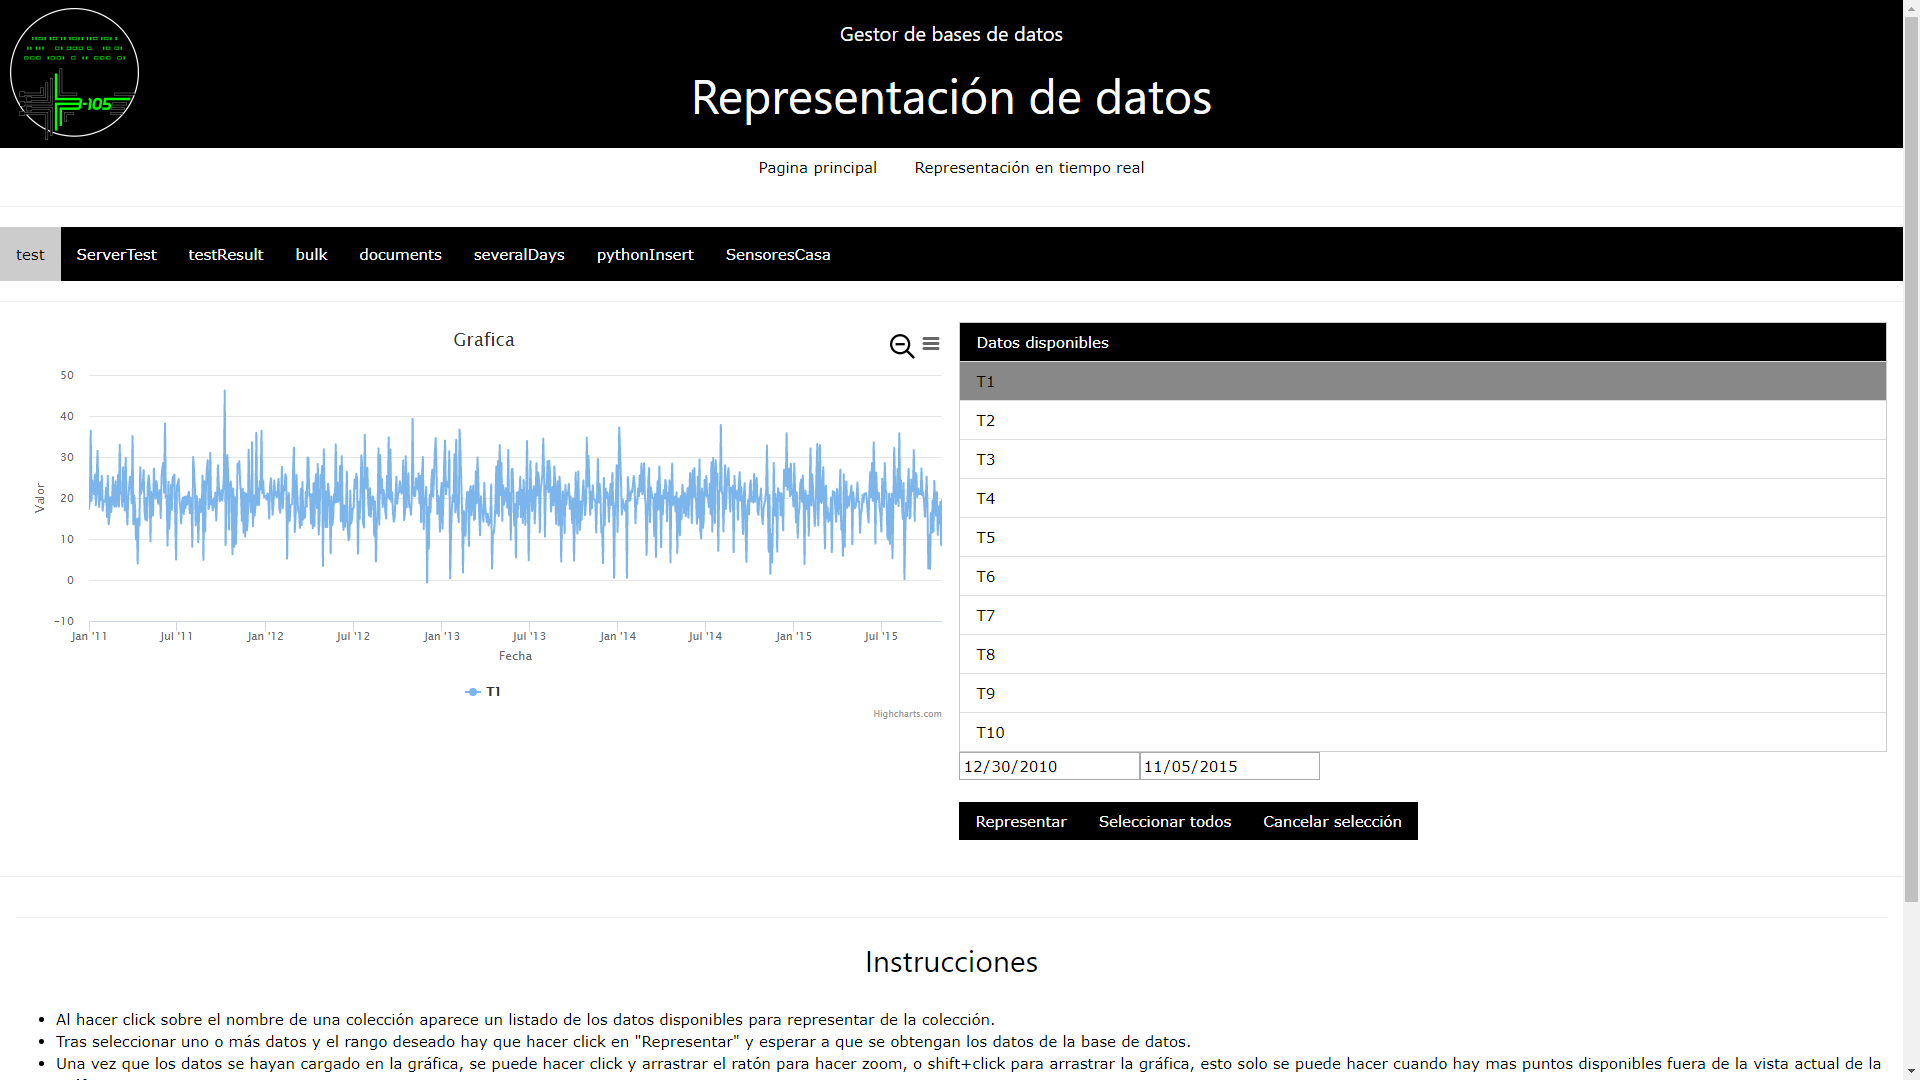
This project consists of a Web application (making it cross-platform) that allows management of a database using a simple user interface. It is also able to select a small sample of data (independently of the amount of data in the database) and plotting it. Finally, it can also be used to monitor live data. These last two functions are extremely useful in domotics, since the data that’s used in those applications (temperature, pressure) are very easy to interpret when plotted.
In order to carry out this project we used MongoDB, a NoSQL database. This type of databases have big advantages over traditional SQL databases when taking into account the type of data we are going to store, mainly faster speed and more flexibility. For the web server we used NodeJS, this way all the code written for this project is Javascript, both server-side, using ExpressJS to simplify the development, and client-side, using the native API calls for web manipulation present in most modern web browsers.
Lastly, one of the biggest advantages of our project is the ability to add data to the database sending a HTTP request to a certain URL. With this we can save any type of data from any sensor easily, the only requirement is having a node that supports IP in order to send the HTTP request, which is something very common nowadays.